Þingvellir Rift
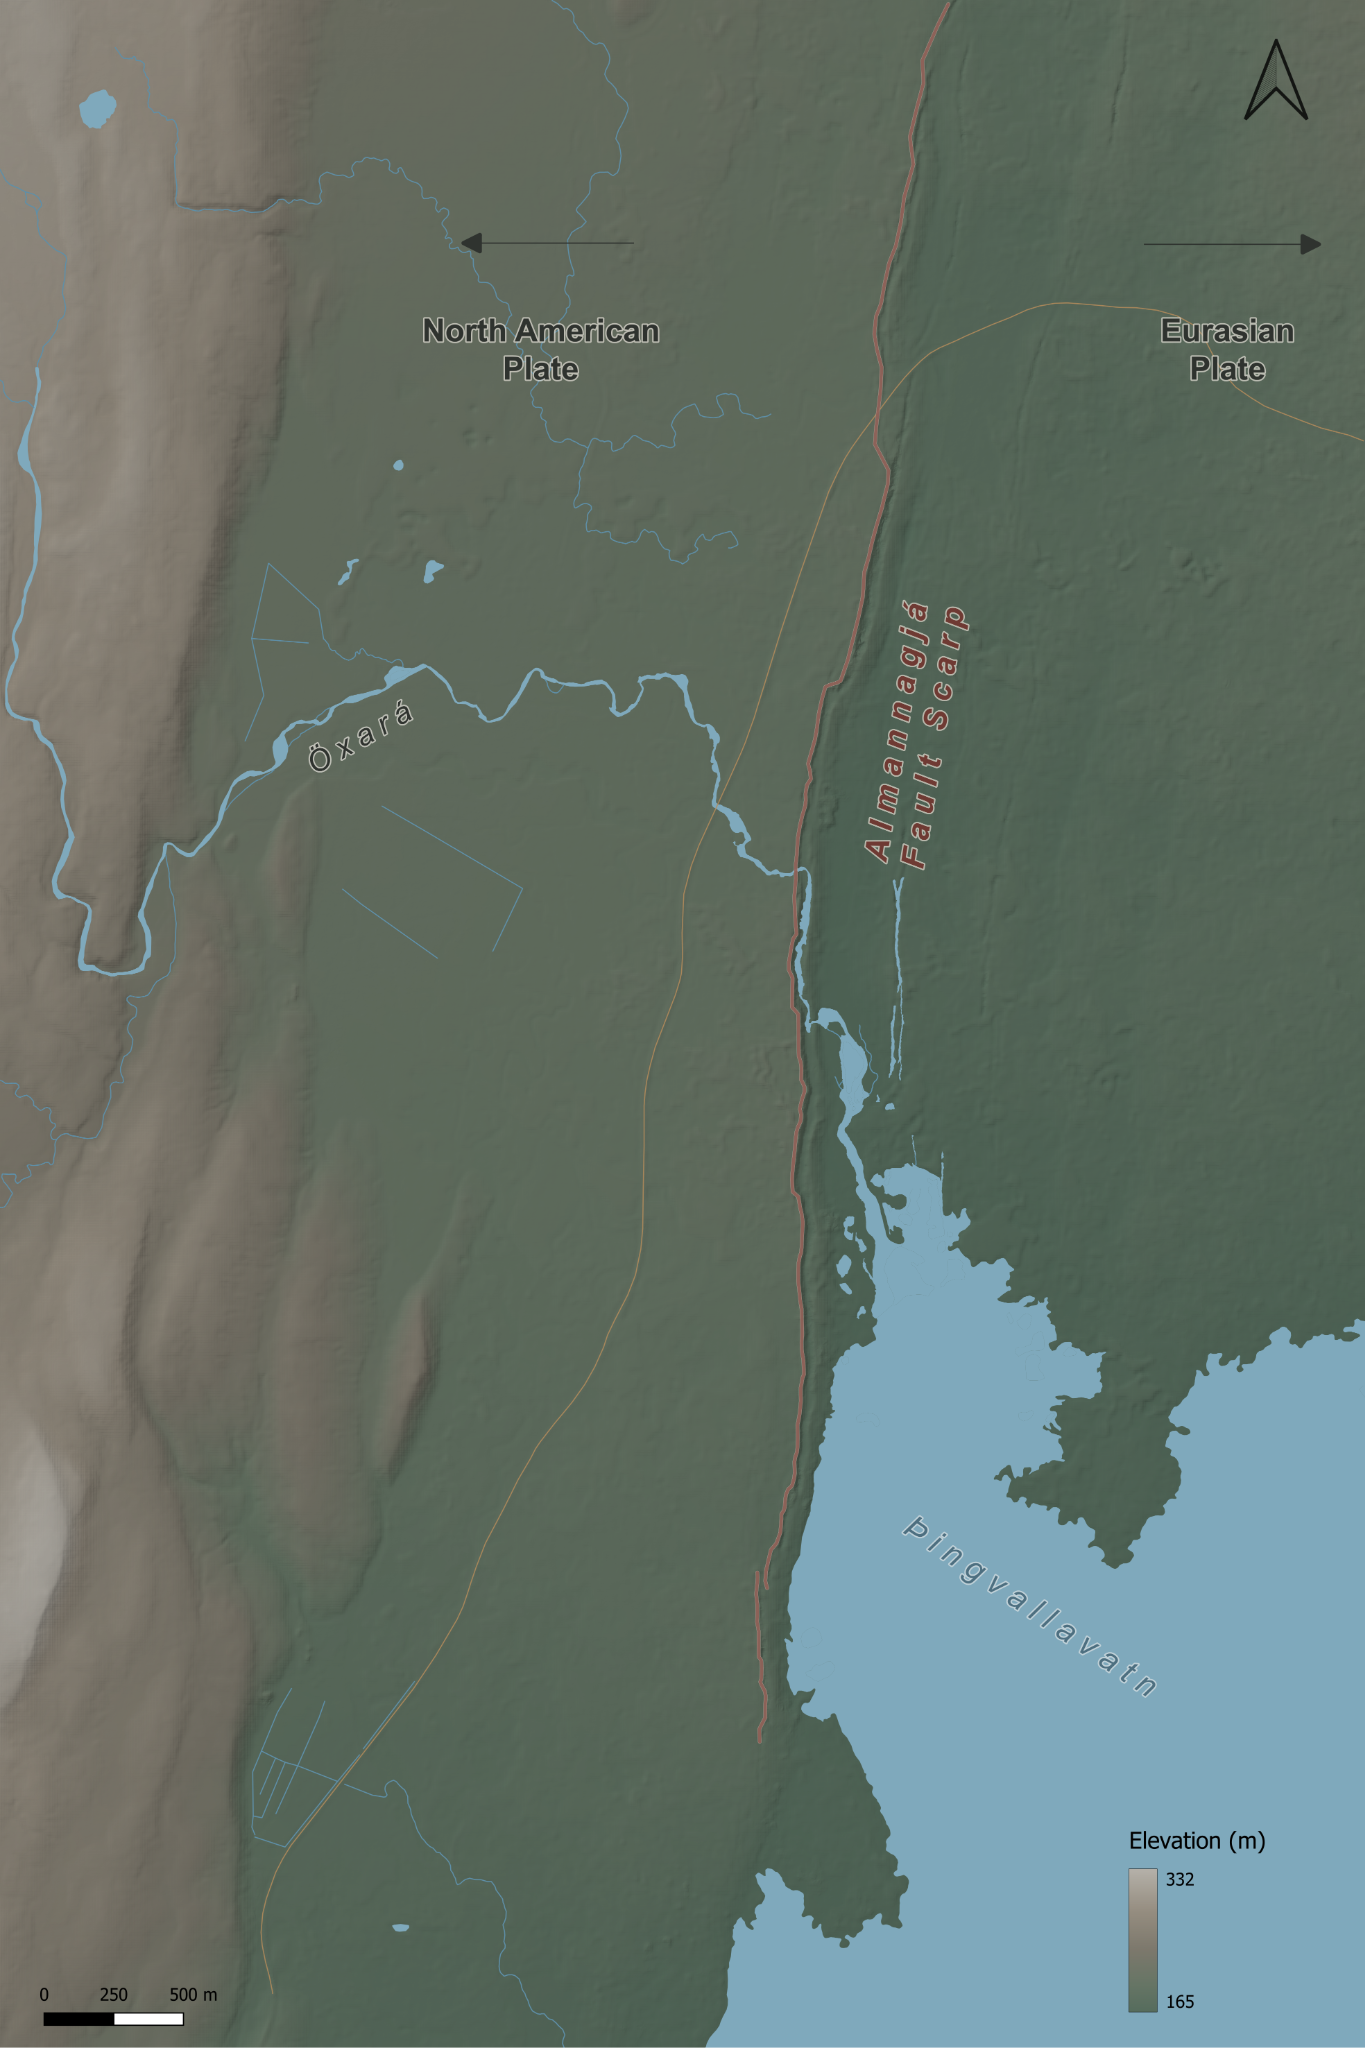
Explore a real earthquake landscape through a relief map, interactive terrain and a printable model designed for Year 5 geography.
Investigate how plates pulling apart create faults and shape the landscape around Almannagjá, Öxará and Þingvallavatn.
A landscape for learning
The model connects tectonic movement to visible evidence: steep fault scarps, lower ground and a rift valley. Six information points combine geographical explanations, images and observation questions for KS2.
The 3D viewer uses 1.75× vertical exaggeration to make subtle relief easier to see. The plate arrows are a simplified teaching illustration; this is a broad fault zone, rather than a single precise boundary line.
Map and printable model
Full map
Single-page PDF · 14.3 MB
Four A4 map tiles
Four-page PDF · 3 mm bleed · trim to 166.67 × 250 mm per tile · print at 100%
Relief map
Full-resolution PNG · 2.7 MB
Documentation
GIS and model workflow
Data, terrain preparation, cartography, print settings and design decisions.
Data credits
Elevation: ArcticDEM v4.1, Polar Geospatial Center. Hydrography: IS 50V Vatnafar, National Land Survey of Iceland. Map design and teaching presentation: Mr Lane. Full source and image credits appear in the interactive viewer and documentation.
Making the physical model
How the printed paper map is fitted to the terrain, finished and mounted on plywood.